Providing information about the Great East Japan Earthquake
and the state of Japan today via an integrated visual language
March 11, 2011 14:46-
Hypocenters and intensity levels of earthquakes tremor


- Sources and Notes
- This graph utilizes data up to 0:02 on April 30, 2012 from 14:46 on March 11, 2011 from "Search of Perceptible Earthquakes in All Parts of Japan" from the "Seismic Intensity Scale Database Search" provided by the Japan Meteorological Agency.
- This graph utilizes "Seismic intensity level ≧ 4" data based on "The 2011 Off the Pacific Coast of Tohoku Earthquake (from 14:00 March 11, 2011) – Table of Earthquake Counts (Including Main Tremor) by Maximum Seismic Intensity for Intensities of 4 and Higher" provided by the Seismological and Volcanological Department of the Japan Meteorological Agency.
- The information lists the maximum intensity level at the center of each of the areas listed in "Names of Areas Used in Emergency Earthquake Information and Intensity Bulletins*," provided by the Japan Meteorological Agency.
- M 9.0 indicates a moment magnitude of 9.0 based on CMT analysis.
- Intensity: The intensity levels shown here are from the Seismic Intensity Scale of the Japan Meteorological Agency (JMA), and indicate the degree of ground shaking. This scale is composed of 10 levels (0, 1, 2, 3, 4, 5, 5 Upper, 6 Lower, 6 Upper, 7). The intensity is measured by seismic intensity meters and the results are announced by the JMA.
- The graph begins from intensity level 3, described as "Felt by most people in buildings."
- Reference sites: "Summary of Tables explaining the JMA Seismic Intensity Scale""Methods of Calculating Measured Earthquake Intensity*"
- *These titles are original translations by NDC of the Japanese source titles.
March 11, 2011
Heights of tsunamis caused
by the main earthquake in all parts of Japan Jun 3,2011
- *1 The offshore wave heights indicate the heights measured by GPS buoys, and are ordinarily less than the heights measured on shore.
- Sources and Notes
-
- Information provided here utilizes "Tsunami Observations (Issued at 18:05 JST 13 Mar 2011)," provided by the Japan Meteorological Agency (JMA). Locations where tsunami measurements are not available utilize "Tsunami Heights Near Tsunami Observation Stations Estimated by Local Investigation (Announced April 5, 2011)*" provided by the JMA.
- Indicated positions of GPS wave measurement buoys utilize "List of Wave Measurement Points," provided by the "Real-time NOWPHAS" information network which is operated by the Ports and Harbours Bureau of the Ministry of Land, Infrastructure, Transport and Tourism.
- The illustration below was created based on "Relationship Between Tsunami Height Measured at Tide Stations and Tsunami Trace Height*," provided by the JMA.

- The values shown are maximum wave heights.
- Because the tide stations at Tokachi-ko-, Ishinomaki-shi Ayukawa, Tomakomai-higashiko, and Soma were damaged by the Tsunami and stopped recording, heights are indicated as "...m or higher." The actual tsunami heights are thought to be higher.
- Because the equipment at the observation sites in Hachinohe, Miyako, Kamaishi, and Ofunato were damaged, the tsunami measurements are not available. The wave height was estimated based on traces of the tsunami and other evidence.
- The bars have been inclined 45 degrees to the left to make the locations of the tide stations more easily visible.
- The figures are updated at each announcement from the JMA.
- * These titles are original translations by NDC of the Japanese source titles.
Area surrounding
the Fukushima Daiichi Nuclear Power Plant:
- Sources and Notes
- Information provided here utilizes "Readings of integrated Dose at Monitoring Post out of 20 Km Zone of Fukushima Dai-ichi NPP*" and "Readings of Air Dose Rate at Monitoring Posts out of TEPCO Fukushima Dai-ichi and Dai-ni NPP by Vehicle-Borne Survey*" issued by the Ministry of Education, Sports, Science and Technology. Updated as new information is issued by the ministry.
- The bars have been inclined 45 degrees to the right to make the locations of the monitoring posts more easily visible.
- * These titles are original translations by NDC of the Japanese source titles.
(Japan only)
Radiation levels across Japan and in major global cities
- Sources and Notes
- Information provided here utilizes "Reading of environmental radiation level by prefecture*" issued by the Ministry of Education, Sports, Science and Technology. Updated as new information is issued by the ministry
- Information for global cities utilizes data from the websites listed below. Results are rounded to two decimal places.
Beijing:"近期北京市辐射环境质量信息" (July 7, 2011 data. Conversion: 1 Gy/h = 0.8 Sv/h)
Toronto, Canada: "Health Canada's Radiation Monitoring Data" (Average value for July 1 – 7, 2011. Conversion: μSv/day → μSv/h)
Hong Kong:"Ambient Gamma Radiation Level in Hong Kong" (July 7, 2011 data for King's Park)
Paris: "IRSN - Surveillance de la radioactivité de l'air en France - Données du réseau Téléray" (7:55 July 8, 2011 data for Paris) - The bars have been inclined 45 degrees to the right to make the locations of the cities more easily visible.
- * These titles are original translations by NDC of the Japanese source titles.
Major global cities and areas of elevated background radiation
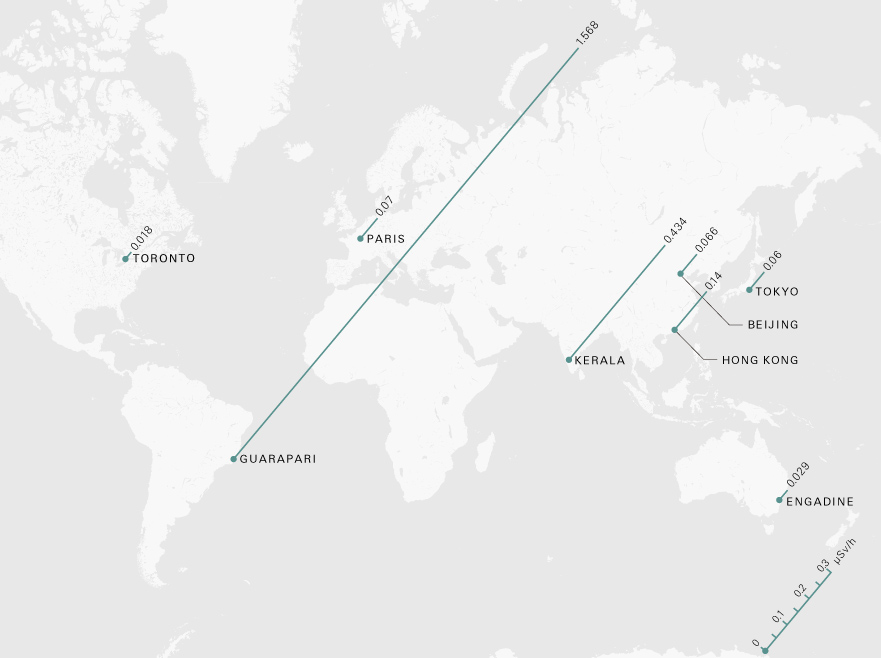
- Sources and Notes
- Information provided here uses data from the following websites. All values are rounded to two decimal places.
Toronto, Canada: "Health Canada's Radiation Monitoring Data" (Average value for July 1 – 7, 2011. Conversion: μSv/day → μSv/h)
Guarapari, Brazil: "ブラジルの高自然放射線地域における住民の健康調査 (09-02-07-03) - ATOMICA -" (From document "Atomica" updated in May 1998. Conversion: 5.5 mGy/year → 1 Gy/h = 0.8 Sv/h. Provided as an example of locations in the world with elevated levels of background radiation.)
Paris: "IRSN - Surveillance de la radioactivité de l'air en France - Données du réseau Téléray" (7:55 July 8, 2011 data for Paris)
State of Kerala, India: "インドの高自然放射線地域における住民の健康調査 (09-02-07-02) - ATOMICA -" (From document "Atomica" updated in May 1998. Conversion: 3.8 mGy/year → 1 Gy/h = 0.8 Sv/h. Provided as an example of locations in the world with elevated levels of background radiation.)
Hong Kong: "Ambient Gamma Radiation Level in Hong Kong" (July 7, 2011 data for King's Park)
Beijing: "近期北京市辐射环境质量信息" (July 7, 2011 data. Conversion: 1 Gy/h = 0.8 Sv/h)
Tokyo: "環境放射能水準調査結果(Reading of environmental radioactivity level by prefecture*)" (Sum of data from 0:00 to 9:00 on July 7, 2011, converted to an hourly average.)
Engadin, Australia: "ANSTO | Radiation monitoring" (July 8, 2011 11:00 data. Conversion: 1 Gy/h = 0.8 Sv/h) - The bars have been inclined 45 degrees to the right to make the locations of the cities/states more easily visible.
- * These titles are original translations by NDC of the Japanese source titles.
- Information provided here uses data from the following websites. All values are rounded to two decimal places.
:Power usage
and maximum power supply capacity(TEPCO service area)Updated:
:
- Sources and Notes
- Graphs beginning from June 28, 2011 utilize the "Graph which shows Use of Electric Power (within TEPCO Service Area)*" provided by TEPCO.
- The horizontal axis of the graph shows the average hourly power demand. (For example, the 13:00 value is the average power demand for the period from 13:00 – 14:00.)
- "Maximum power supply capacity" may vary depending on the conditions of power demand.
- "Maximum power supply capacity" and "Maximum power demand (forecast)" for Saturdays, Sundays, and holidays are in general the values which were forecast on the preceding day.
- * These titles are original translations by NDC of the Japanese source titles.
Power usage and maximum power supply capacity
beginning from March 22, 2011 (TEPCO service area) Updated:
:
- Sources and Notes
- Graphs beginning from June 28, 2011 utilize the "Graph of Electricity Use (within TEPCO's service area)" provided by TEPCO.
- "Maximum power supply capacity" may vary depending on the conditions of power demand.
- "Maximum power supply capacity" and "Maximum power demand (forecast)" for Saturdays, Sundays, and holidays are in general the values which were forecast on the preceding day.
- * These titles are original translations by NDC of the Japanese source titles.
Daily power usage of this year and last year (TEPCO service area)Updated:
:
- Sources and Notes
- Information provided here utilizes "Graph of Electricity Use (within TEPCO's service area)" and "Download past electricity demand data" provided by TEPCO
- "Maximum power supply capacity" may vary depending on the conditions of power demand.
- "Maximum power supply capacity" and "Maximum power demand (forecast)" for Saturdays, Sundays, and holidays are in general the values which were forecast on the preceding day.
Scheduled blackouts
At present, no scheduled blackouts are being carried out. Hokkaido Electric Power Company / Tohoku Electric Power Company / Tokyo Electric Power Company / Hokuriku Electric Power Company / Chubu Electric Power Company / Kansai Electric Power Company / Chugoku Electric Power Company / Shikoku Electric Power Company / Kyushu Electric Power Company / Okinawa Electric Power Company
- Concept

Basic policy
- 1. No dramatization
- 2. No opinions
- 3. Communication that can be easily understood by people around the world
- 4. Maximum possible accuracy
- Message

We would like to offer our deepest sympathies to all of those affected by the Great East Japan Earthquake. Although the destruction of entire towns over an area stretching for 500 kilometers to the north and south is of an almost unimaginable scale, we believe that this immense devastation can be overcome and we hope that during the process of rebuilding the disaster-affected region, we can also discover a path for the future of Japan and the world.
The earthquake has also brought the new crisis of radioactive contamination to Japan. Not only is there the physical issue of the cleanup following the nuclear accident, but one of the first steps on the path to recovery must be to reduce the negative image which people have of Japan as a country contaminated by nuclear radiation, and thereby lessen the damage to Japanese industry, by presenting the world with an objective look at the current situation – at least within a range that is reasonable to modern science.
Under the name "311 SCALE," Nippon Design Center has begun a project aimed at presenting data from the Great East Japan Earthquake in visual form. We are creating graphs which illustrate issues such as how the earthquake and tsunami struck, and the radiation levels in each area affected by the nuclear accident, based on a fundamental approach of no dramatization, no opinions, producing communication that can be understood easily by people around the world, and achieving the maximum possible accuracy.
Creating an entirely neutral visual representation of numerical figures is not always an easy task. Graphs provide a clear representation of the numbers, however while a graph can efficiently express the characteristics of these numbers, at the same time the visual representation automatically generates something which can guide the viewer toward certain conclusions. Although a graph should be entirely objective, in fact it can produce a bias in its interpretation as a result of the images which the viewer derives from its form.The graphs which are creating are no exception; however we are committed to avoiding unnecessary explanation and interpretive perspectives to the maximum extent possible, and will endeavor to provide the most objective viewpoint of Japan today. We hope that viewers will approach this information from a non-emotional and open perspective.
- Sources:Information on this homepage may be used freely subject to the restriction that it be used in accordance with the precautions and disclaimers on the following source sites. Current as of July 11, 2011.
![]()
- Copyright
- The ownership rights, publishing rights and copyrights to all image data, text data and other data that exists on this website (hereafter referred to as "Site Data") are retained by the copyright holder Nippon Design Center (hereafter referred to as "NDC"). The duplication, diversion, sale or other secondary use of the Site Data is prohibited without the permission of NDC.
- Links to this website
- In general the top page and individual pages of this website may be linked to freely, however, links from websites which are not consistent with public order and morals, or websites which may not be so consistent, are not permitted. Due to the nature of this website, NDC may request that links be removed if it determines that there is the risk of arbitrary misconstruction of website information.
- Disclaimer
- The Site Data posted on this website has been examined with extreme care, and the sources of the information are disclosed. However NDC provides no guarantee of any kind to the persons accessing this website (hereafter referred to as "Users") regarding the accuracy, reliability, suitability for stated purpose, safety, or other aspects of this information.
NDC shall bear no liability of any kind regarding any actions taken by Users utilizing the information on this website or any loss sustained by Users as a result of such actions. - Other
- Be aware that the information on this website may be changed without notice, and that operation of this website may be interrupted or terminated according to circumstances. NDC shall bear no liability of any kind for damages incurred as a result of information changes, or interruption or termination of website operation, regardless of the reason.